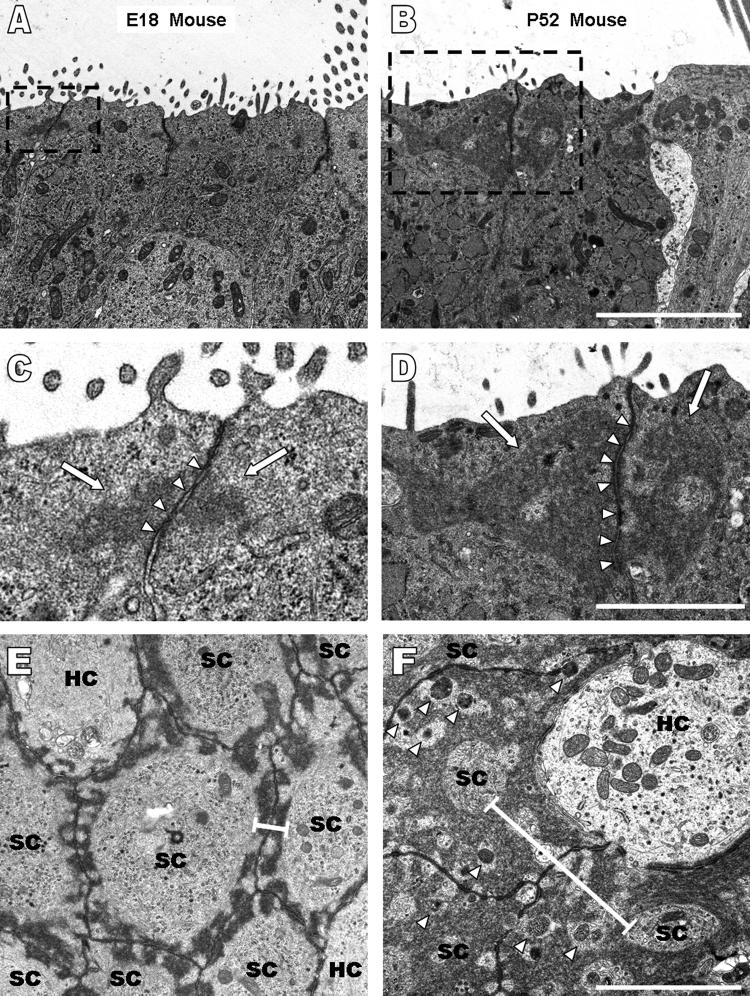
Figure 5.
Ultrastructural analysis of longitudinal and transverse sections of utricles from mice ranging in age from embryonic day 18 (E18) to postnatal day 52 (P52) demonstrate circumferential F-actin bands increase in width, not intercellular junctions; and there is a coinciding increase in the height of F-actin bands. A-B) Increases in the vertical dimension of circumferential F-actin bands parallel to the lateral membrane are seen in longitudinal sections from an E18 and P52 mouse. Scale bar for A and B in B, 10 μm. C-D) High magnification images of the boxes outlined with black dashes in A and B show the intercellular junction (arrow heads) does not change in width while the F-actin bands extend further from the junction as mice age. Scale bar for C and D in D, 2 μm. E-F) Transverse sections from an E18 mouse (E) and a P52 mouse (F) provide a view identical to that seen in confocal images. Circumferential F-actin bands (width shown by black bars) almost cover the entire apical planar area of the supporting cells by P52. The size of the intercellular junctions, however, remains the same at both ages. Vesicles (arrow heads) are visible in the F-actin bands in the transverse section from the P52 mouse. Scale bar for E and F in F, 2 μm.

