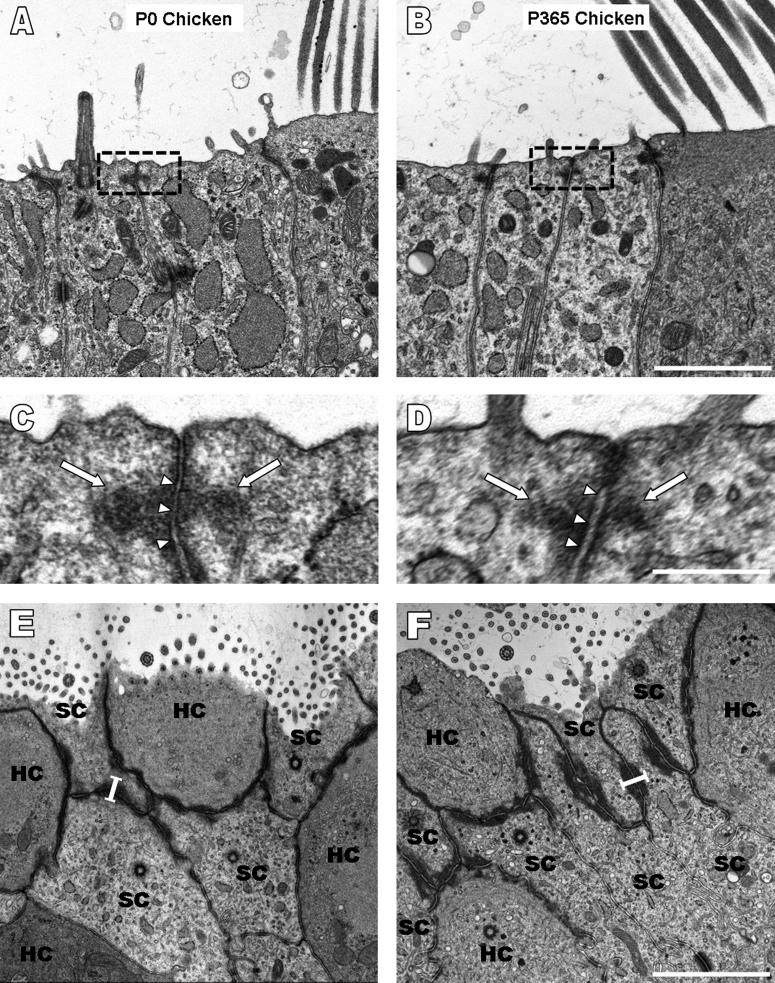
Figure 8.
Ultrastructural analysis of longitudinal and transverse sections of utricles from chickens ranging in age from postnatal day 0 (P0) to P365 demonstrates that circumferential F-actin bands remain narrow in the vertical dimension in addition to width. A-D) The vertical dimensions of F-actin bands (arrows in C and D) at the adherens junctions (arrowheads in C and D) in TEM images of longitudinal sections from a P0 and P365 chicken are thin and comparable. Scale bar for A and B in B, 2 μm. Scale bar for C and D in D, 0.5 μm. E-F) Transverse sections provide a view identical to that seen in confocal images, and the width (black bars) of the F-actin bands in P0 (E) and P365 (F) chickens is similar. Scale bar for E and F in F, 2 μm.

