Figure 3.

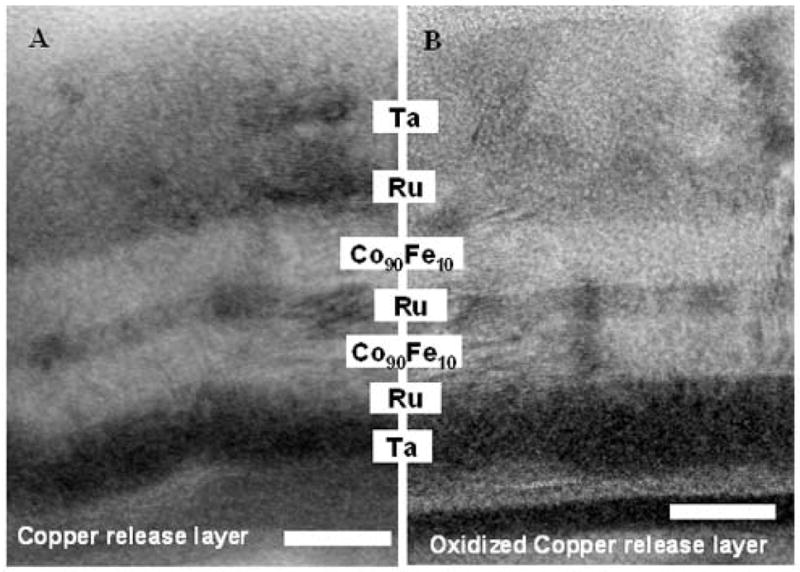
TEM bright field images of SAF structure deposited on (A) copper release layer (no oxygen) and (B) oxidized copper release layer. Wavy inter-layers are observed in (A). The scale bar denotes 10nm.

TEM bright field images of SAF structure deposited on (A) copper release layer (no oxygen) and (B) oxidized copper release layer. Wavy inter-layers are observed in (A). The scale bar denotes 10nm.