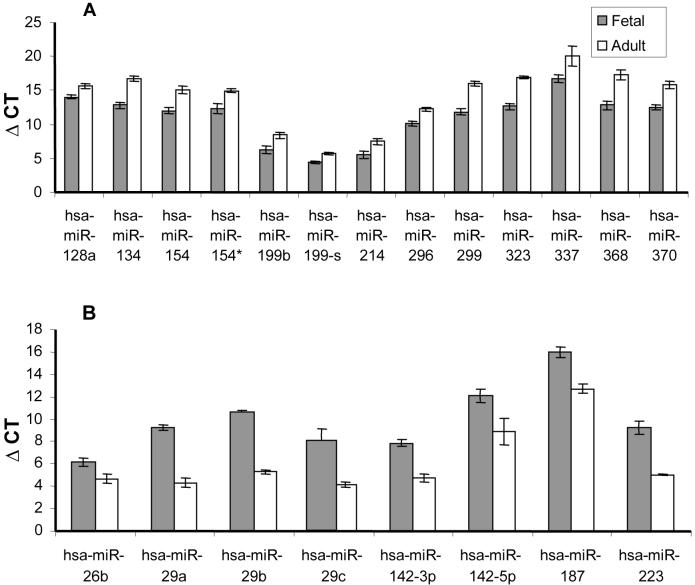
Figure 3. Differential expression of miRNAs during human lung development.
All values were normalised against 18s CT values and are therefore represented as ΔCT (the lower the value the more highly expressed). A. The miRNAs expressed more highly in fetal human lung compared to adult human lung. B. The miRNAs that are more highly expressed in adult human lung compared to fetal human lung. Only those miRNAs that were statistically significant (p<0.05) are represented and are given as mean ± SEM (n=3).

