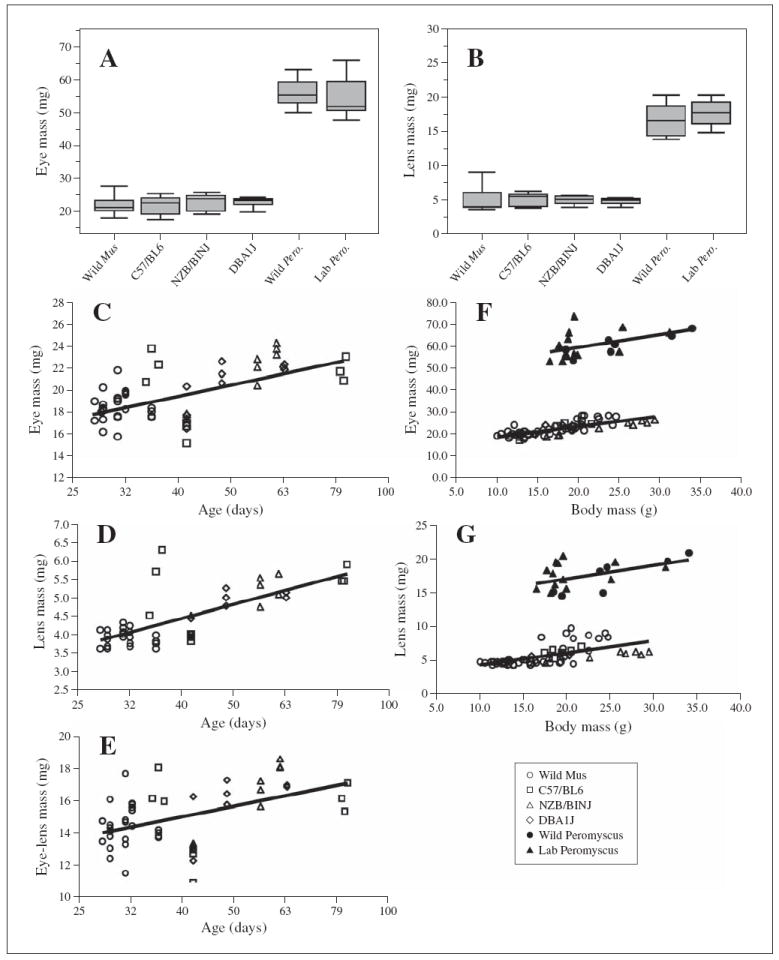
Fig. 1.

Eye and lens masses for wild and laboratory strains of M. musculus and P. maniculatus. A Box plot of eye masses for wild and laboratory strains (box stretches from the 25th percentile to the 75th percentile; the median is a line across the box; box lies between minimum and maximum values). B Box plot of lens masses for wild and laboratory strains. C–E Regression analysis of eye mass (C), lens mass (D), and eye mass minus lens mass (E) as a function of the log of age (although actual age is indicated on the figure); each symbol represents data collected from a single mouse. All data shown are from M. musculus strains. F, G Regression analysis of eye mass (F) and lens mass (G) as a function of body mass for wild and laboratory M. musculus strains.
