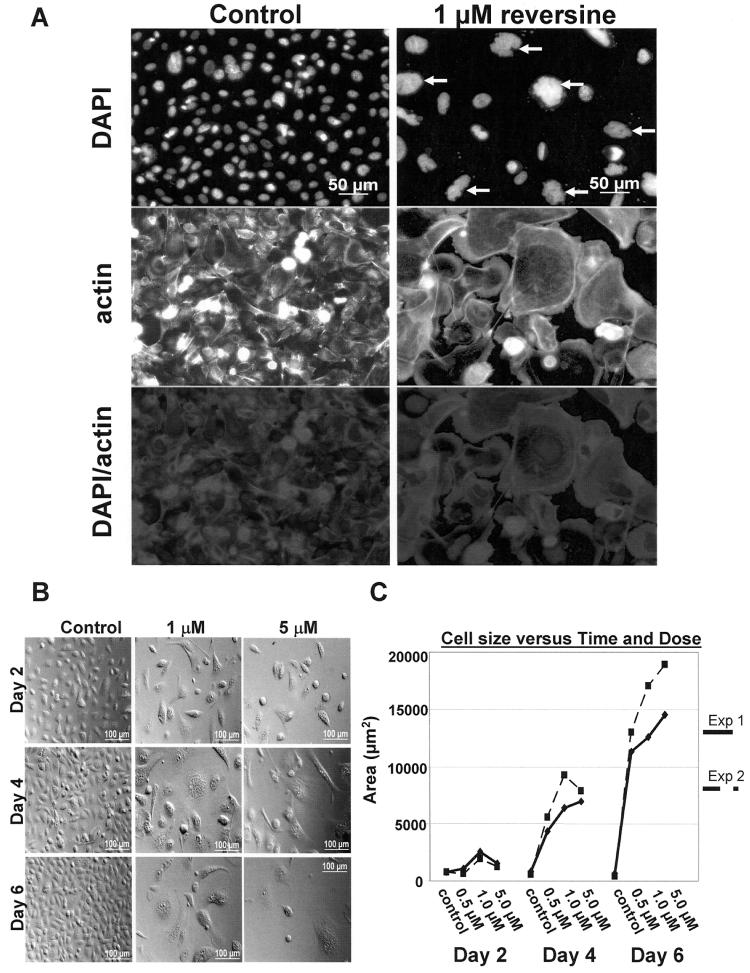
Figure 3.
Induction of polyploidy in RV-treated PC-3 cells. (A) Analysis of day 4, 1 μM RV (top right panel)-treated cells compared to the control cells (top left panel). Cells were stained with DAPI to reveal nuclei and with anti-actin to identify the entire outline of cells. Actin staining showed enlarged RV-treated cells (middle right panel), compared to control cells (middle left panel). Merge images (bottom panel) localize the nuclei and the cytoplasm. (B) Morphological [as assayed by differential interference contrast (DIC) microscopy] analysis illustrating cell size changes in PC-3 cells induced by increasing concentrations of RV at 2, 4, and 6 days of treatment. (C) Quantitation of cell size changes in PC-3 cells induced by increasing concentrations of RV at 2, 4, and 6 days of treatment.

