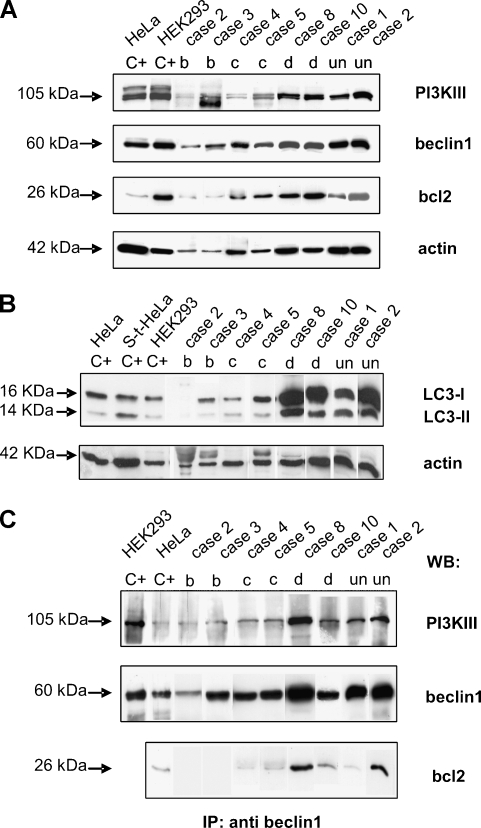
Figure 2.
Autophagy-related protein expression in imatinib-treated and untreated GISTs (A and B) and their interactions in the autophagic process (C). (A) Western blot analyses using anti-PI3KIII, antibeclin1 and anti-bcl2 antibodies: the arrows indicate the bands corresponding to the three proteins and their molecular weights. The anti-actin antibody was used as a control for protein loading and amount, corresponding to the residual cellularity of each analyzed sample. Lanes C+: positive controls (HeLa and HEK293 cell lines). The numbers correspond to the cases listed in Table 1, and letters correspond to the histological responses of the samples (residual tumoral cells: b, 10–50%; c, 50–90%; d, >90%); un: untreated patient. (B) Western blot analyses using anti-LC3B antibody: the arrows indicate the bands corresponding to LC3-I and LC3-II and their molecular weights. The anti-actin antibody was used as control for protein loading and amount, corresponding to the residual cellularity of each sample. Lanes C+: positive controls [HeLa, staurosporine-treated HeLa (S-t HeLa), and HEK293 cell lines]. The numbers correspond to the cases listed in Table 1, and letters correspond to the histological responses of the samples (residual tumoral cells: b, 10–50%; c, 50–90%; d, >90%); un: untreated patient. (C) Coimmunoprecipitation experiments. Total protein extract (1 mg) from each sample was immunoprecipitated using anti-beclin1 antibody, run on gel, and blotted with the indicated antibodies: the arrows indicate the bands corresponding to the three investigated proteins, and their molecular weights. Lanes C+: positive controls (HEK293 and HeLa cell lines for WB PI3KIII and beclin1; HeLa cell line alone for WB bcl2). The numbers correspond to the cases listed in Table 1, and the letters correspond to the histological responses of the samples (residual tumoral cells: b, 10–50%; c, 50–90%; d, >90%); un: untreated patient.

