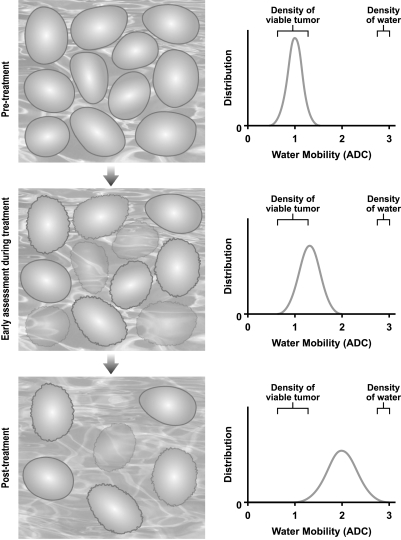
Figure 1.
Schematic representation of diffusion MRI measured response to therapy. Changes in tumor cellularity (left) and increased molecular water mobility measured as the ADC (right) as a tumor responds to treatment (top to bottom). For a tumor responding to therapy, an increase in extracellular space/membrane permeability would be anticipated to increase both water mobility and ADC.

