Fig. 4.
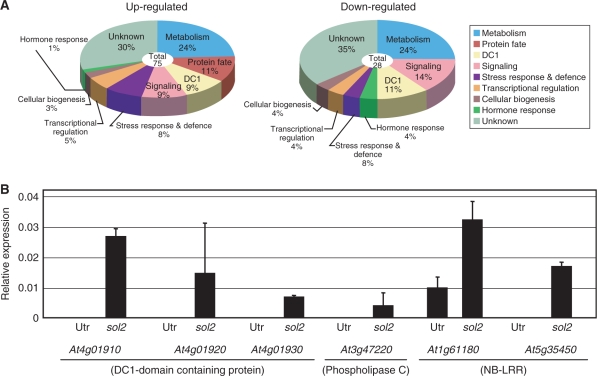
(A) Identification of genes down- or up-regulated in the sol2 mutant root tip using GeneChip analysis. Samples were grown on MS agar plates without CLV3 peptide for 4 d and the RAM region of 2 mm from the root tip was collected for this analysis. Gene expression profiles of the wild-type and the sol2 mutant root tips were analyzed with GeneChip. The up- and down-regulated genes, in both the duplicated experiments, were categorized into nine groups by the common functions of their putative gene products. Lists of the genes are given in Supplementary Tables S1 and S2. (B) Quantitative RT–PCR of up-regulated genes in the sol2 mutant root tip. Changes in gene expression of At4g01910, At4g019420, At4g01930, At3g47220, At1g61180 and At5g35450 were calculated relative to the abundance of the TUA4 gene. Bars denote standard deviations (n = 3). For all samples, P <0.01 (t-test, Utr vs. sol2).

