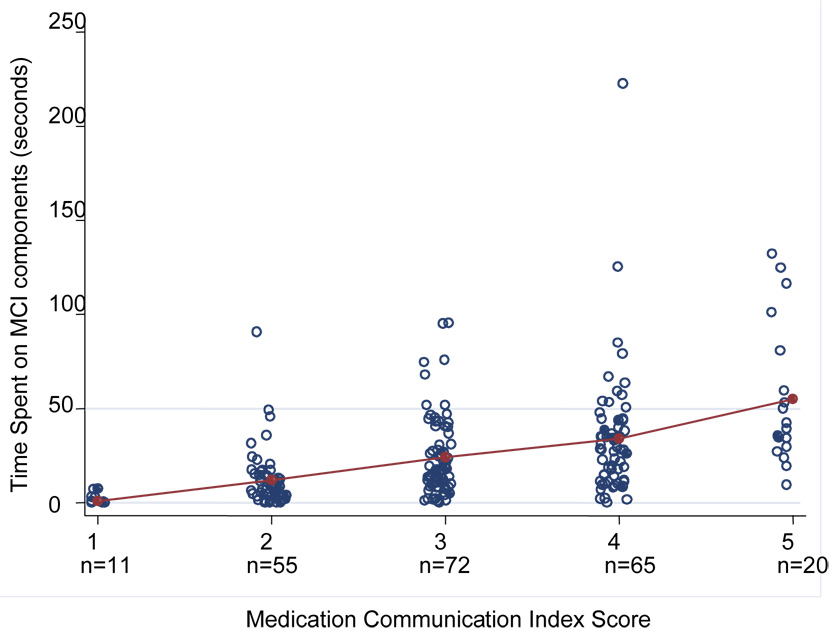
Figure 1.
Relationship of Medication Communication Index (MCI) score to time (in seconds) spent discussing MCI components of individual medications. Mean times for discussion are represented by the lines in the graph. Each dot represents data for an individual medication. A small amount of random jitter is added to each MCI score to better visualize overlapping data points.

