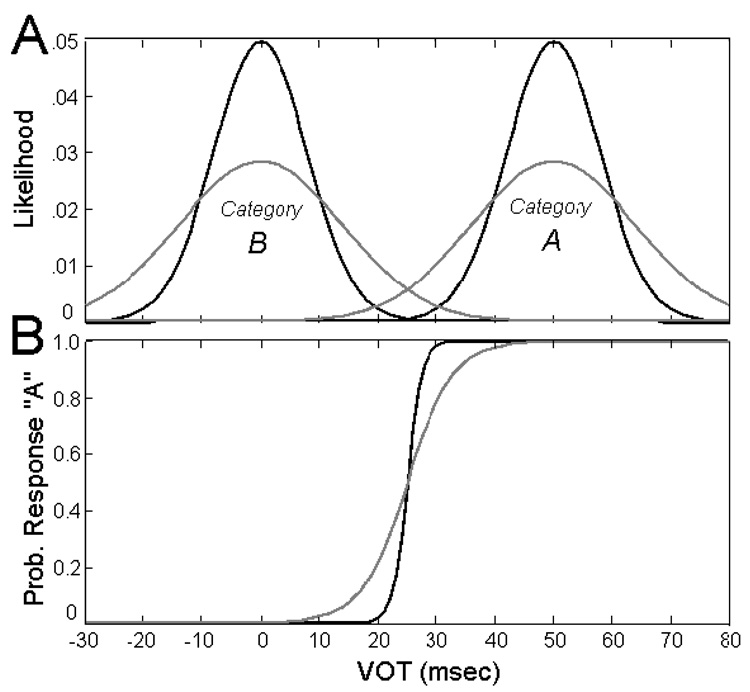
Figure 1.
[A] Probability distributions of tokens that listeners categorized in the narrow condition (dark lines) and wide condition (light lines). [B] Optimal response curves calculated from the probability distributions using Equation (1) for the narrow condition (dark lines) and wide condition (light lines).

