
FIG. 4.
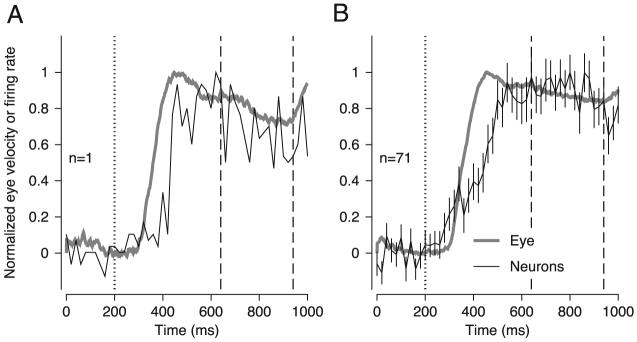
Evolution of eye velocity and extraretinal responses of medial-superior-temporal area (MST) neurons over time. A: an example neuron. B: averages across 71 MST neurons. Thick gray traces indicate average eye velocity in response to 10°/s target motion; black trace indicates the average firing rate. Dotted vertical trace indicates onset of target motion. Dashed vertical lines indicate the onset and offset of the stabilization period delayed by 100 ms. Firing rate and eye velocity magnitudes have been normalized to make them directly comparable. Error bars in B indicate SE. The firing rate traces consisted of only 50 points because firing rate was computed in 20-ms bins. Target speed was 10°/s.