
Figure 5. PM3 (lesion proportion difference) maps for deficits in naming and recognition.
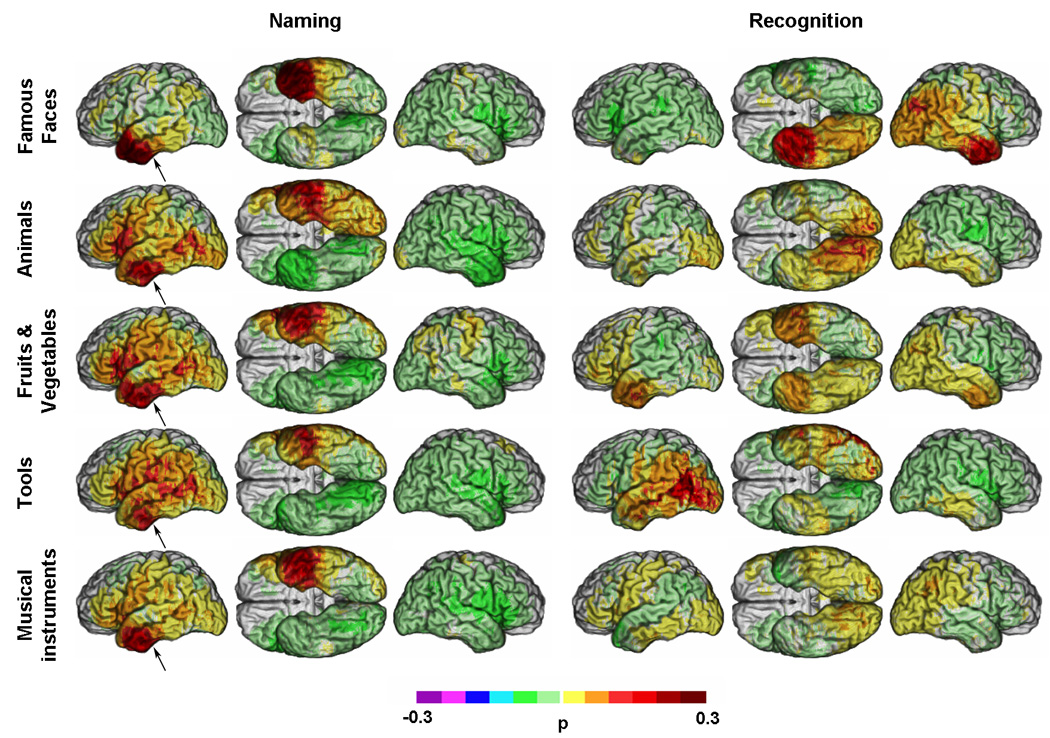
Unthresholded PM3 results overlaid on a reference brain. Positive values (see colorbar) indicate a greater proportion of subjects with a lesion and a deficit among those with a deficit than a lesion and no deficit among those with no deficit. Negative values (see colorbar) indicate a lower proportion of subjects with a lesion and a deficit among those with a deficit than a lesion and no deficit among those with no deficit. (Same conventions as Figure 2). Arrows indicate one of the regions discussed for which discrepencies were observed between M3 and PM3.