
Figure 6. Thresholded lesion overlap difference maps for deficits in naming and recognition (p < 0.05).
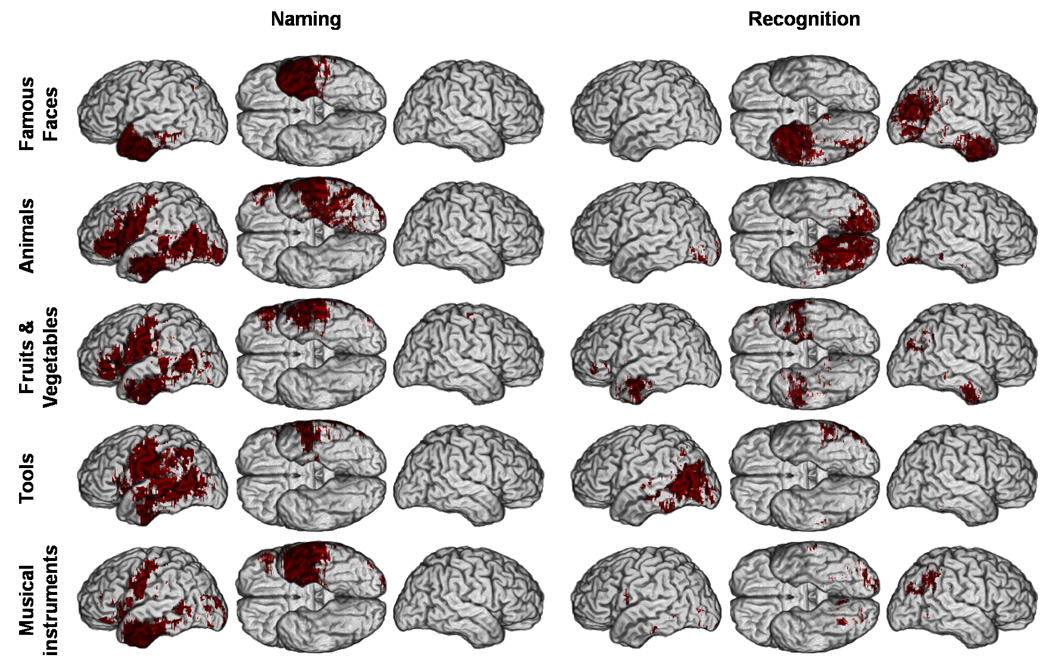
Thresholded M3 results overlaid on a reference brain. Dark red indicates a significant difference between the number of subjects with a lesion and a deficit versus the number of subjects with a lesion and no deficit. (Same conventions as Figure 2).