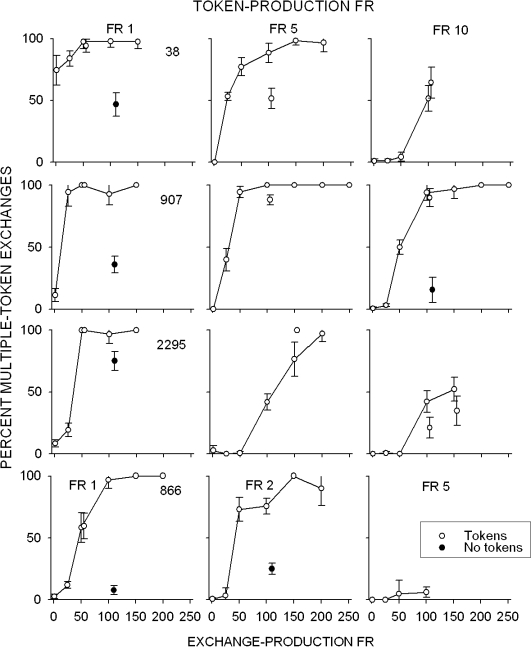
Fig 1.
Percentage of exchange periods during which multiple tokens were exchanged as a function of token-production and exchange-production ratios, for each pigeon averaged across the final five sessions of each condition. Error bars are standard deviations. Token-production ratios are depicted across columns, and exchange-production ratios within columns. Replications are represented by detached, unfilled points, and no-token conditions by detached, filled points. Replication and no-token condition symbols are slightly horizontally displaced to avoid overlapping data points.

