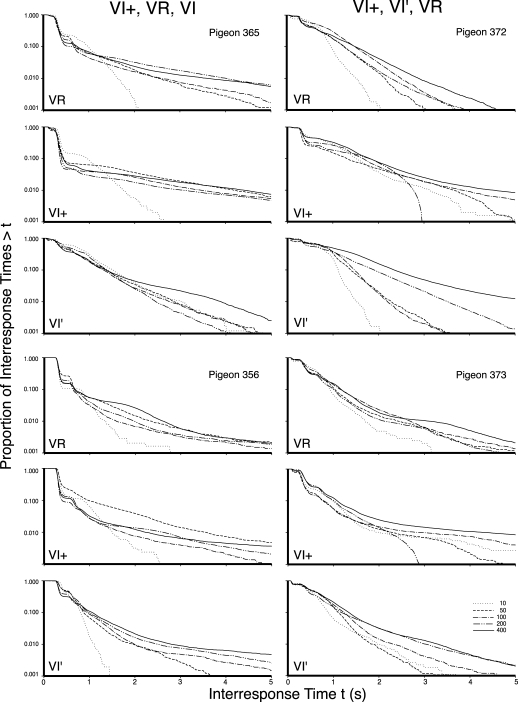
Fig 4.
The log survivor plots for all pigeons in Experiment 1 that began with exposure to VI+ schedules. The left column provides the VI+, VR, and then VI′ exposure sequence, while the right column displays the VI+, VI′, and then VR exposure sequence. The top, middle, and bottom frame for each pigeon depicts the VR, VI+, and VI, respectively. The five functions within each frame provide the data for the schedule values as indicated in the legend.

