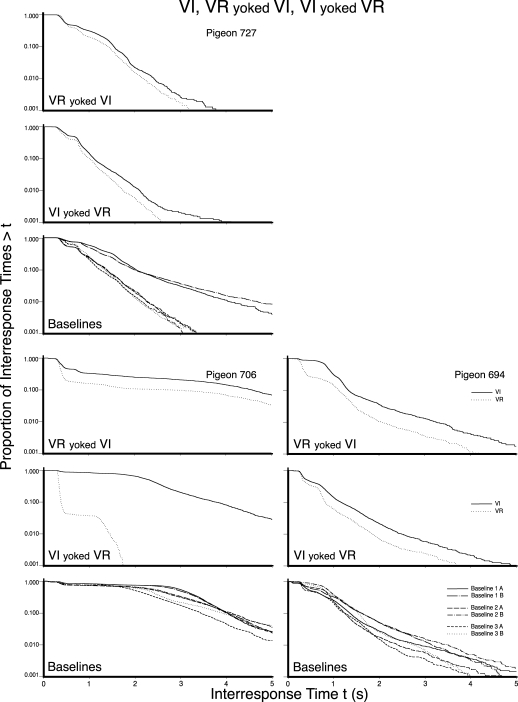
Fig 7.
The log survivor plots for the 3 pigeons in Experiment 2 that received VI pretraining and counterbalanced yoked conditions. The top, middle, and bottom frame for each pigeon provides the results of the VR yoked VI, the VI yoked VR condition, and the three implementations of the baseline, respectively. The functions within each frame provide the data for the schedule values as indicated in the legend.

