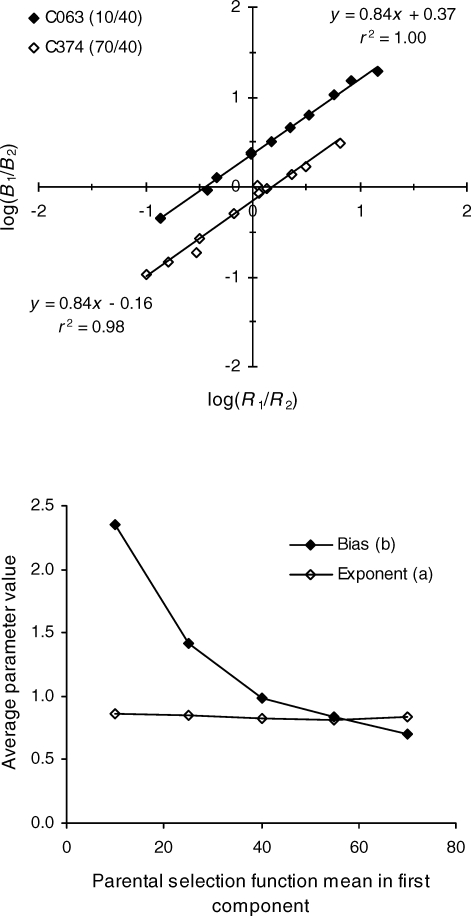
Fig 3.
Top panel: Filled diamonds represent data from repetition C063, in which parental selection function means of 10 and 40 were arranged in the two components of the concurrent schedule. The best-fitting line is plotted through the points, and its equation and the proportion of variance it accounts for are given in the upper right of the panel. Unfilled diamonds represent data from repetition C374, in which parental selection function means of 70 and 40 were arranged in the two components of the concurrent schedule. The best fitting line is plotted through the points and its equation and the proportion of variance it accounts for are given in the lower left of the panel. Bottom panel: Average bias parameters (filled diamonds) and exponents (open diamonds) plotted against the mean of the parental selection function arranged in the first component of the schedule. Averages are across the individual parameter values listed in Tables 1 and 2.

