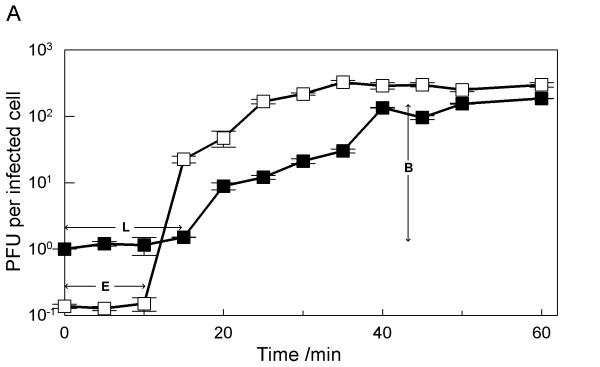
Figure 4.
One-step growth curve of phage ϕIBB-PF7A in P. fluorescens at RT. Shown are the PFU per infected cell in untreated cultures (■) and in chloroform-treated cultures (□). The phage growth parameters are indicated in the figure and correspond to: E-eclipse period; L-latent period and B-burst size.

