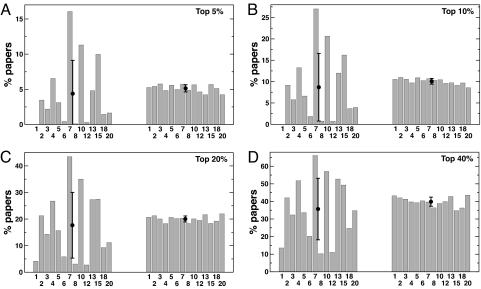
Fig. 3.
We rank all articles according to the bare number of citations c and the relative indicator cf. We then plot the percentage of articles of a particular discipline present in the top z% of the general ranking, for the rank based on the number of citations (A and C) and based on the relative indicator cf (B and D). Different values of z (different graphs) lead to a very similar pattern of results. The average values and the standard deviations of the bin heights shown are also reported in Table 2. The numbers identify the disciplines as they are indicated in Table 1.

