Fig. 3.
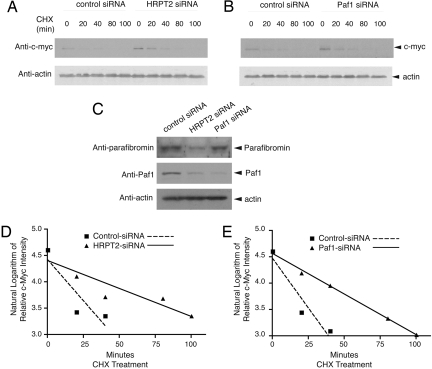
Analysis of c-myc protein stability and half-life in response to inhibition of parafibromin or Paf1 expression. (A and B) Cultured HeLa cells were treated with control siRNA, HRPT2- or Paf1-specific siRNA. At 48 h after transfection, cycloheximide (CHX) was added to the culture medium and the cells were collected at 0, 20, 40, 80, and 100 min. Cell lysates were analyzed by immunoblotting using anti-c-myc or anti-actin antibodies. (C) The expression of parafibromin and/or Paf1 at the zero time point was analyzed by immunoblotting. The expression of β-actin is shown as a loading control. (D and E) Linear regression analysis of the natural logarithm of the relative intensity of c-myc protein expression in control and HRPT2- (D) or Paf1- (E) specific siRNA treated cells at different times of CHX treatment, quantified by quantitative ECL analysis and normalized to β–actin expression, is shown. In this analysis the y-value at time = 0 for all plots was 4.61 (the natural log of 100 [%] relative expression), and a y-value of 3.91 (indicating a relative expression of 50 [%]) maps to the time corresponding to the c-myc protein half-life.

