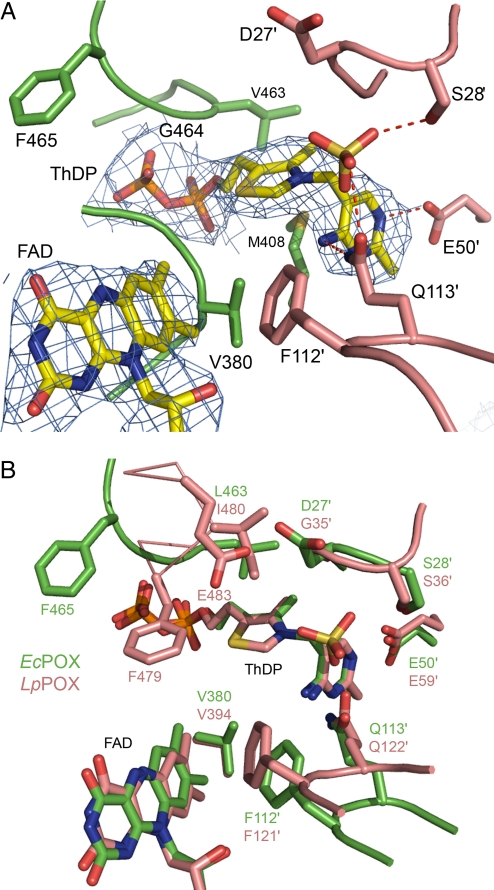
Fig. 4.
Active site of EcPOX. (A) Structure of the active site showing ThDP, FAD, an oxyanion and selected amino acid residues in stick representation. The electron density of the 2 cofactors is contoured at 1.0 σ in a 2Fo − Fc map. Amino acids contributed from the neighboring subunit are shown in a different color code and are labeled with an apostrophe. (B) Superposition of the active centers of EcPOX (green) and the related LpPOX (pink) in stick representation. The 2 active centers are largely conserved, residue F465 (F479 in LpPOX), however, is pointing away from the active site in EcPOX.

