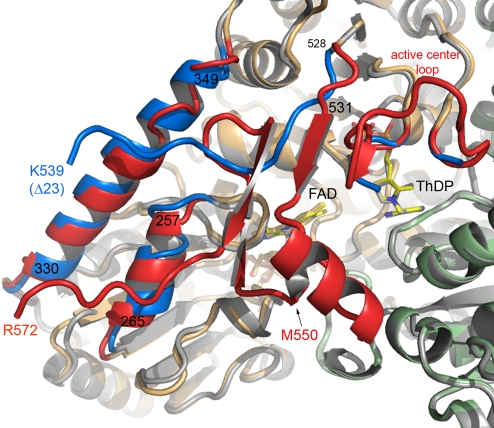
Fig. 5.
Structural differences between full-length and EcPOXΔ23. Superposition of full-length EcPOX (monomers colored in orange and green) and EcPOXΔ23 (gray) viewed down the substrate channel in diagram representation. Regions with marked structural differences are highlighted: blue, EcPOXΔ23; red, full-length EcPOX. ThDP and FAD are shown in stick representation.

