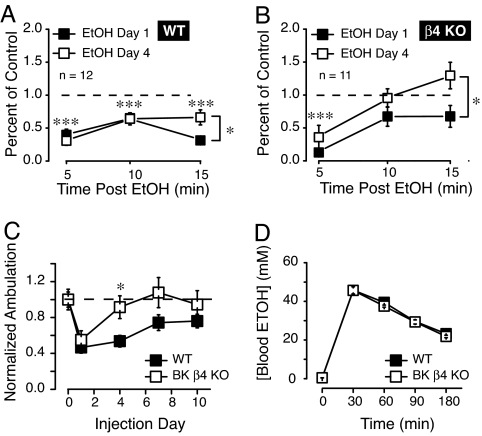
Fig. 4.
Effects of EtOH on locomotor activity in male WT and β4 KO mice. (A) Ambulatory activity of WT mice 5, 10, and 15 min after a 2 g/kg i.p. EtOH injection on days 0, 1, and 4. Each data point represents 5 min summed activity. Asterisks above symbols indicate significant locomotor activity on both days 1 and 4 of EtOH injection at each time point (5, 10, and 15 min) compared to saline injection baseline (represented by the dashed line). Asterisk next to bracket indicates difference between days 1 and 4 at 15 min time point only. (B) Effects of the same EtOH dose at the same time points in KO mice. (C) Fifteen minute summed activity immediately after a daily ethanol injection. Note the rapid development of tolerance for KO mice upon repeated injections of 2 g/kg EtOH, compared to WT mice. (D) Blood alcohol concentration in WT and KO mice (n = 4) before (time 0) and at 30-min intervals after a single i.p. injection of 2 g/kg ethanol. One-way ANOVA, Tukey posthoc, * P < 0.05, *** P < 0.001.

