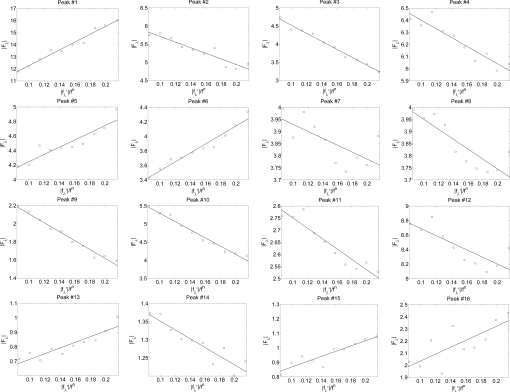
Fig. 3.
Multiwavelength anomalous diffraction analyses for the detected peaks. For each independent peak, the square root of the integrated intensity, ∣Fλ∣, is plotted as a function of ∣f′λ∣/fn. The data are fit with a straight line, from which ∣F0∣, ∣F2∣, and the ratio ∣F0∣/∣F2∣ are obtained. The results are in Table 1.

