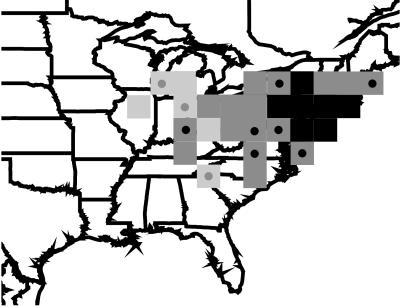
Figure 1.
Time when ≥ 20% disease prevalence was reached in 29 2° × 2° blocks in eastern North America from which data were analyzed. The darkest shading indicates ≥ 20% prevalence in 1994, midtone shading indicates ≥ 20% in 1995, and lightest shading indicates ≥ 20% prevalence in 1996. Darker circles within the center of a square indicate that the epizootic achieved ≥ 20% prevalence in the first half of a year. The data from each block were treated as one observation unit.

