Fig. 3.
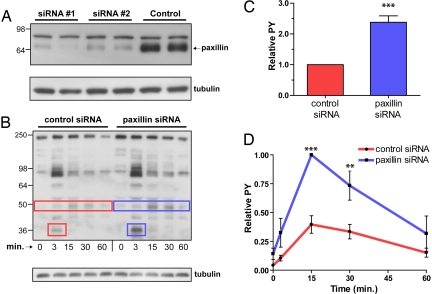
Paxillin knockdown affects phosphorylation stimulated by IgE-FcεRI. (A) Immunoblots show that paxillin-specific siRNA causes >90% decrease in paxillin expression levels. To confirm knockdown, the same PDVF membrane was stripped and reprobed with anti-tubulin as a loading control. (B) Antigen-stimulated phosphorylation was examined in lysates from suspended whole cells (2 × 10⁶/ml) 48 h after siRNA delivery, sensitization with anti-DNP IgE, and stimulation with DNP-BSA (50 ng/ml) for the times indicated. After SDS/PAGE, gels were blotted with anti-phosphotyrosine antibody, 4G10. Boxes indicate 35-kDa (p35) and 50-kDa (p50) bands that are consistently increased after paxillin knockdown in this representative experiment; anti-tubulin bands serve as loading control. (C) Densitometric analysis of tyrosine phosphorylation (PY) for p35 band (FcεRI β) after 3-min stimulation. (D) Densitometric plot showing stimulation time course for relative tyrosine phosphorylation of the p50 band. (C and D) Data are averaged over five different experiments in which the phosphorylated band was normalized by tubulin band (loading control). The data were further normalized to control (sham knockdown) cells (C) or to the 15-min time point in the knockdown cells (D). **, P < 0.01; ***, P < 0.001. Error bars indicate S.E.M.

