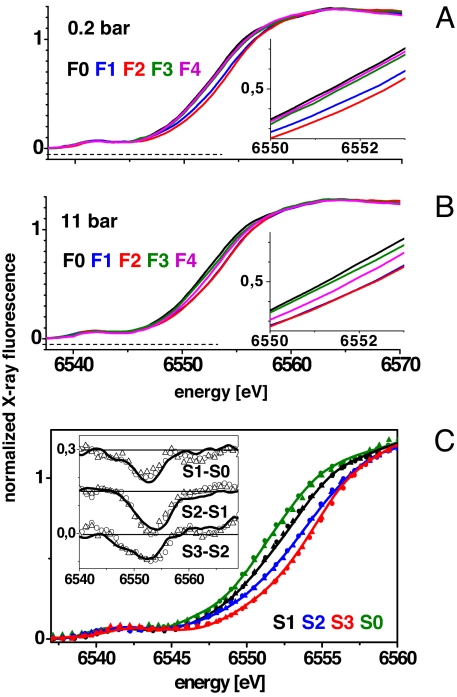
Fig. 2.
XANES spectra of the Mn complex measured after the application of 0–4 laser flashes to PSII samples at pO2 of 0.2 bar (A) and 11 bar (B). Spectra are the average of 2 (0.2 bar) and 4 (11 bar) sets of independently measured spectra. (Insets) Expanded half-height region of the K-edges. (C) Calculated spectra of pure S-states (color code as indicated), obtained by deconvolution of the spectra in A and B using parameters listed in Table 1 [lines, 0.2 bar; triangles, 11 bar O2 (a); dots, 11 bar O2 (b)] and in the legend of Fig. 3. (Inset) Corresponding difference spectra.

