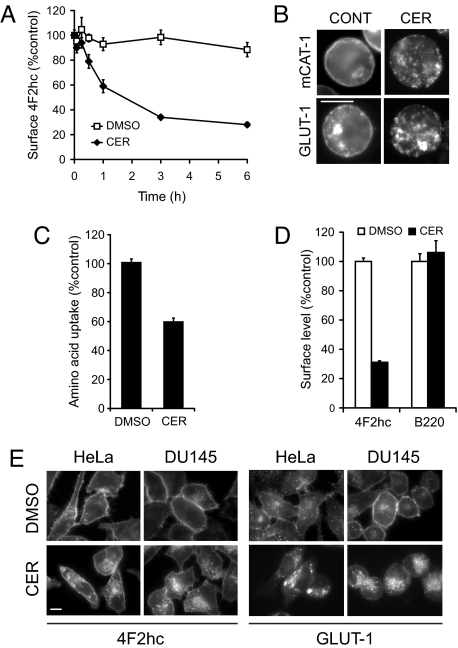
Fig. 2.
Ceramide decreases nutrient transporter expression. (A) Surface 4F2hc was measured by flow cytometry in cells treated with DMSO or 25 μM C2-cer. Similar results were obtained with 50 μM C2-cer. (B) mCAT-1 and GLUT-1 expression in cells treated with DMSO or 50 μM C2-cer for 7 h (mCAT-1) or 18 h (GLUT-1, cells expressed Bcl-XL to maintain viability). Scale bar, 10 μm. (C) Amino acid uptake in cells treated with 25 μM C2-cer for 4 h. (D) Surface levels of 4F2hc and B220 were measured in cells expressing Bcl-XL 6 h after treatment with DMSO or 50 μM C2-cer. (E) 4F2hc and GLUT-1 localization in HeLa or DU145 cells treated with DMSO or 50 μM C2-cer for 9 h. Scale bar, 10 μm. Error bars: A, SEM; C and D, SD.

