Fig. 5.
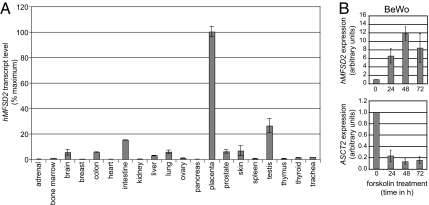
Real-time RT-PCR analysis of MFSD2 transcripts in human tissues (A) and BeWo trophoblast cells (B). (A) MFSD2 mRNA expression in a panel of 20 healthy human tissues as determined by real-time qRT-PCR. Transcript levels were normalized relative to the amount of 18S mRNA and are expressed relative to that in the placenta (same order of magnitude as that of the syncytin-2 gene, data not shown). (B) MFSD2 and ASCT2 expression in BeWo cells upon forskolin induction of cell differentiation and fusion. Cells were treated with forskolin (50 μM) and RNA was extracted at the indicated times after induction of fusion. MFSD2 and ASCT2 mRNA levels were determined by real-time qRT-PCR analysis. They were normalized relative to the amount of 18S mRNA and are expressed relative to that before induction (level taken as unity).

