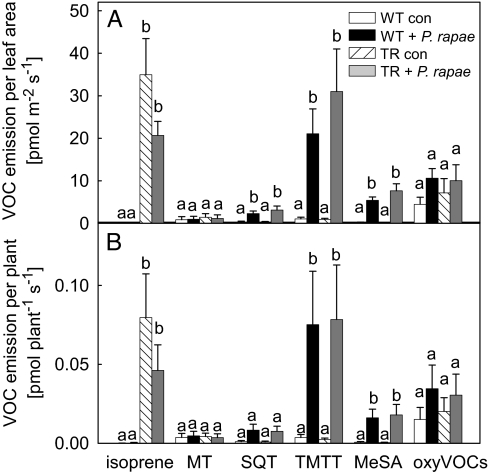
Fig. 2.
Headspace analysis of WT and transgenic Arabidopsis rosettes with and without herbivory. Volatile emission rates based on leaf area basis (A) and per plant (B). White, uninfested WT plant; black, P. rapae-infested WT plant; hatched, uninfested transgenic plant; gray, P. rapae infested transgenic plant. MT, monoterpenes (α-pinene, camphene, β-myrcene, limonene, linalool); SQT, sesquiterpene (α-farnesene); oxyVOCs, other oxygenated volatile organic compounds (10 compounds). Four independent experiments per treatment and line were analyzed, and means ± SE are given. Significant differences (P < 0.05, Mann–Whitney U test) between treatments are indicated by different letters per compound class. (For GC-MS profiles and compound list see Fig. S2 and Table S1).

