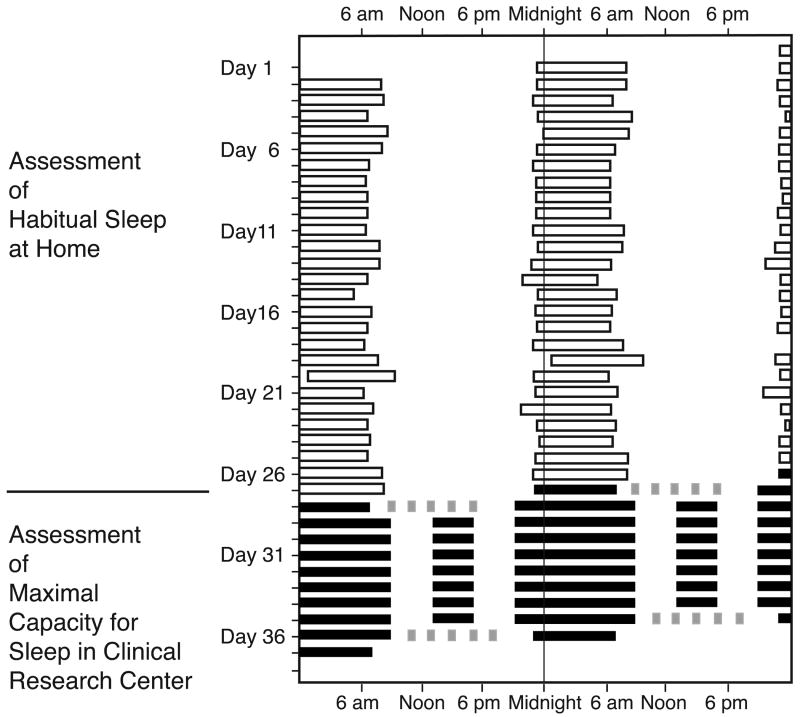
Figure 1.
Protocol and sleep times from one subject. Data are plotted in raster format in which time in hours is plotted horizontally and day number is plotted vertically; two consecutive days are presented on each row. The timing of sleep, as derived from actigraphy and self-report while the subject was at home, is indicated by open boxes. Inpatient sleep episodes are indicated by black boxes and Multiple Sleep Latency Tests by gray boxes. In the present report, we include the data collected through the sleep extension segment of the protocol; data from the second set of MSLTs and following sleep episode are not included.

