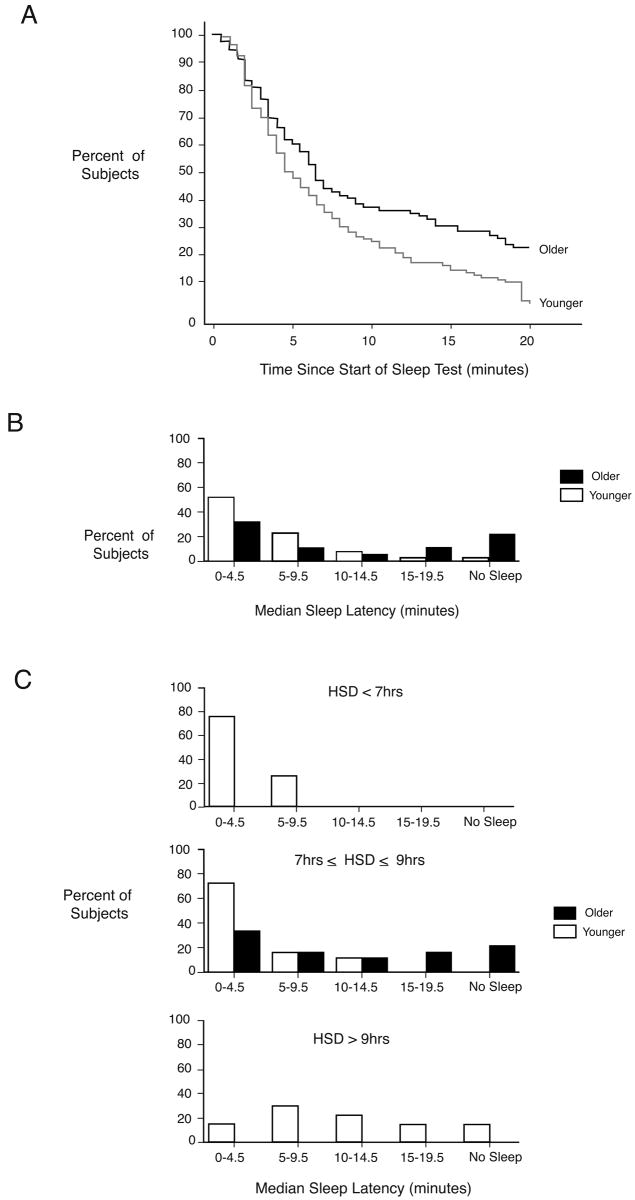
Figure 2.
Daytime sleep propensity as assessed by the Multiple Sleep Latency Test. (a) Survival curves of sleep latency, i.e. the percentage of subjects who are awake for that wake duration or shorter is plotted against elapsed time during 20-minute nap opportunities. Data of all five nap opportunities for each subject are included. (b) Histograms of percentage of older and younger subjects by median sleep latency. (c) Histograms of percentage of subjects by median sleep latency separately for subjects with a Habitual Sleep Duration less than 7 hours, between 7 and 9 hours and greater than 9 hours.

