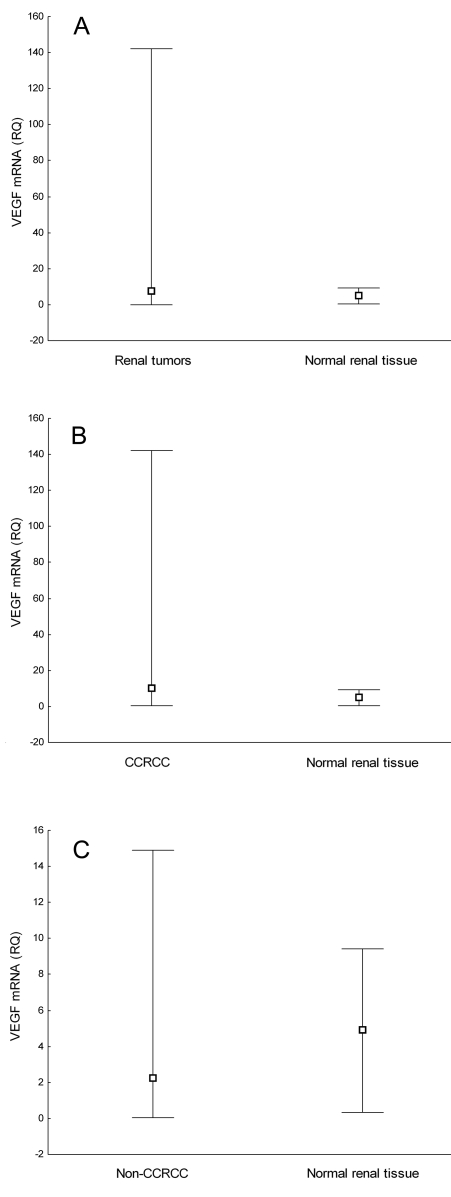
Figure 2.
Comparison of vascular endothelial growth factor (VEGF) messenger RNA (mRNA) relative quantity (A) between normal renal tissue and all renal cell tumors (P = 0.089, Mann-Whitney U-test), (B) between normal renal cell tissue and clear cell renal cell carcinoma (CCRC) (P = 0.013, Mann-Whitney U-test), and (C) between normal renal tissue and non-CCRCC (P = 0.676, Mann-Whitney U-test). Box represents median value and whisker plot represents range.

