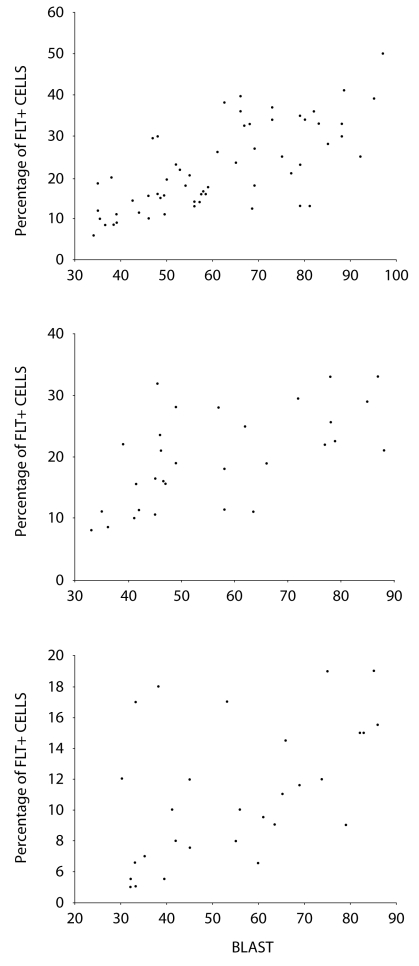
Figure 3.
Surface expression level of fms-like tyrosine kinase 3 (FLT3) analyzed by flow cytometry according to the percentage of bone marrow blasts, FLT3 expression levels increase with the number of bone marrow blasts in acute leukemia. (A) Correlation of FLT3 expression with blasts in bone marrow in acute myeloid leukemia (r = 0.716; P < 0.001); (B) Correlation of FLT3 expression with blasts in bone marrow in B-acute lymphoid leukemia (r = 0.607; P < 0.001); (C) Correlation of FLT3 expression with blasts in bone marrow in T-acute lymphoid leukemia (r = 0.524; P = 0.003).

