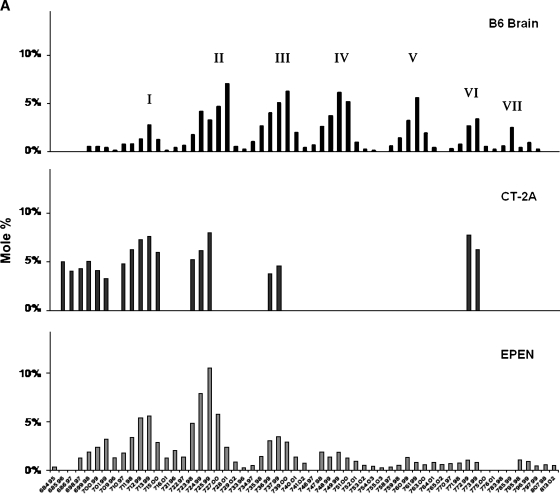
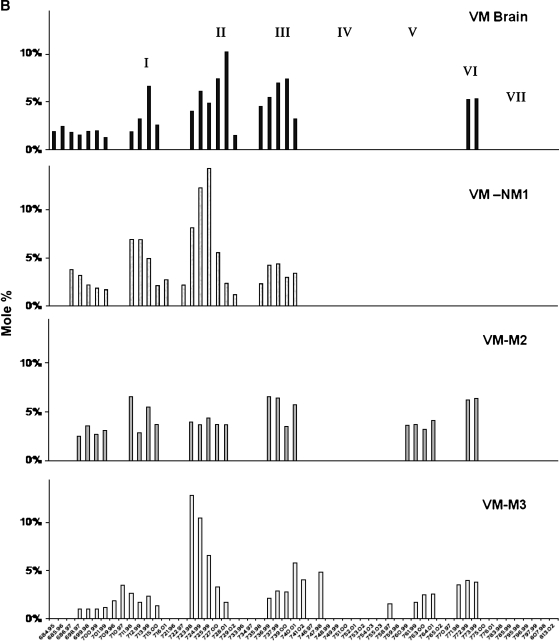
Fig. 3.
Distribution of CL molecular species in mouse brain and brain tumor mitochondria. A: Distribution in B6 mouse brain and in the CT-2A and the EPEN tumors. B: Distribution in VM mouse brain and the VM-NM1, the VM-M2, and the VM-M3 tumors. CL molecular species are arranged according to the mass-to-charge ratio based on percentage distribution and are subdivided into seven major groups as we previously described (38). Corresponding mass content of molecular species in normal brain and tumor mitochondria can be found in Table 1. All values are expressed as the mean of three independent mitochondrial preparations, in which six cortexes or tumors were pooled for each preparation.


