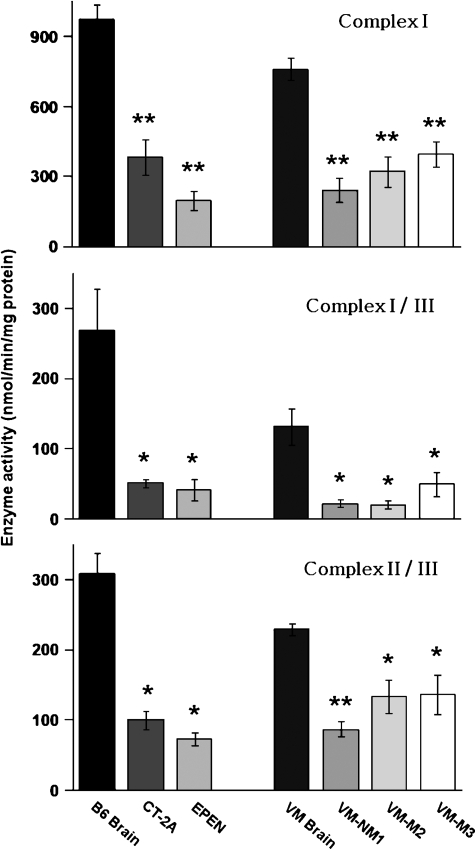
Fig. 4.
Electron transport chain (ETC) enzyme activities of complexes I, I/III, and II/III in mouse brain and brain tumor mitochondria. Enzyme activities are expressed as nmol/min/mg protein as described in Materials and Methods. All values are expressed as the mean of three to four independent mitochondrial preparations, in which six cortexes or tumors were pooled for each preparation. Asterisks indicate that the tumor values differ significantly from the B6 or the VM brain values at the * P < 0.025 or ** P < 0.001 levels as determined by the two-tailed t-test.

