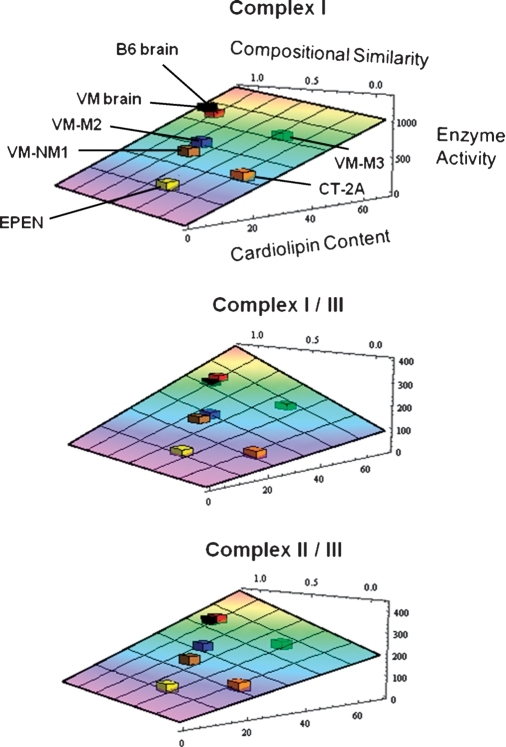
Fig. 5.
Relationship of CL abnormalities to ETC activities in the B6 and the VM mouse brain tumors. The data are expressed on the best-fit three-dimensional quadratic surface for each electron transport chain complex as described in Materials and Methods. To illustrate the position of all tumors on the same graph relative to their host strain, the data for the VM strain and tumors were fit to the B6-fit quadratic surface as described in Materials and Methods.

