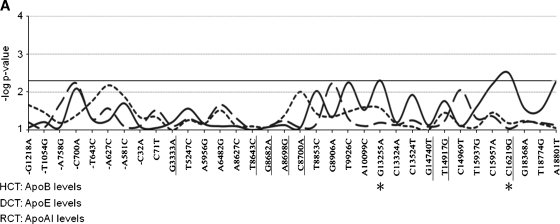
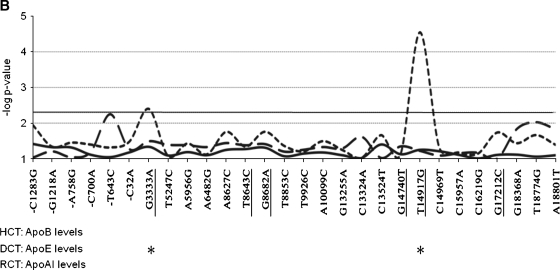
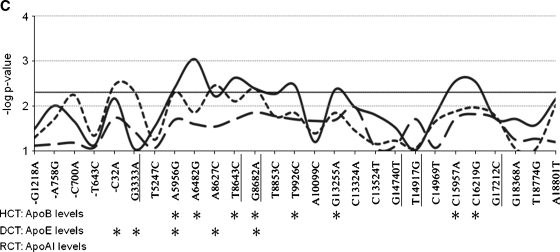
Fig. 1.
Association of individual APOH single-nucleotide polymorphisms (SNPs) with plasma apolipoprotein levels in GENOA. Each APOH SNP is listed on the x axis, and numbered relative to the translational start site. The underlined SNPs are polymorphisms located in the coding sequence of the gene. The y axis shows the point-wise –log P values (not adjusted for multiple testing) for associations (P = 0.05 corresponds to –log P value of 2.3, solid horizontal line). The solid curved lines show associations with apolipoprotein B (apoB) levels (hepatic cholesterol transport), the short dashed curves show associations with apoE levels (dietary cholesterol transport), and the long dashed curves show associations with apoA-I levels (reverse cholesterol transport). Asterisks below the graph mark APOH SNPs that show point-wise significant associations (unadjusted P > 0.05) with each apolipoprotein measure. A: Associations for African American families. B: Associations for Mexican Americans. C: Associations for European Americans.


