
Figure 8.
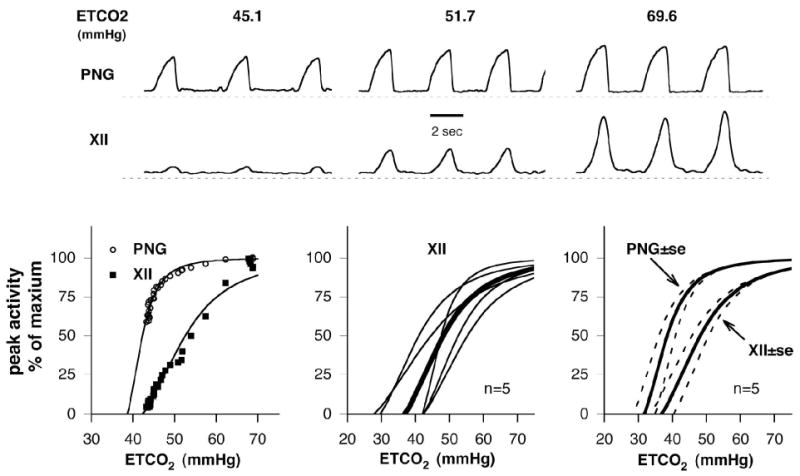
CO2 responses of phrenic nerve and XII nerve activities in hyperoxic decerebrate dogs. Upper: Example of the effects of CO2, measured as end-tidal ETCO2 (mmHg), on the moving-time averages of phrenic nerve activity (PNG, top trace) and XII nerve activity (XII, 2nd trace). Lower Left: plot of normalized peak activity vs. ETCO2 associated with the example from the upper traces. Nonlinear regression was used to fit both nerve activity plots and to aid in extrapolating the apneic thresholds. A hyperbolic function of the form: Y=(X-φ)3/[(X-φ)3+(Xo-φ)3)] was used, where Y is peak activity, X is ETCO2, φ is ETCO2-axis intercept and Xo is the ETCO2 level for 50% of maximum peak activity. The response curve for XII activity is shifted to the right and shallower with a greater linear range compared to the phrenic activity. The apneic thresholds are ~38 and ~42 mmHg for the phrenic and XII activities, respectively. An ETCO2 of ~52 mmHg produced a peak XII activity of 50% of maximum. Lower center: XII nerve activity vs. ETCO2 plots for five dogs (thin lines) and group mean curve (thick line). In three of five animals there was no XII activity below an ETCO2 of 42 mmHg. Lower right: mean curves ± 1 SE bands of both activities. The XII nerve activity curve was consistently right shifted and shallower than the phrenic response curve. ETCO2 levels of 65–70 mmHg were required to produce maximal XII activity. ETCO2 levels required for 50% of maximum ranged from 41–55 mmHg (center plots).