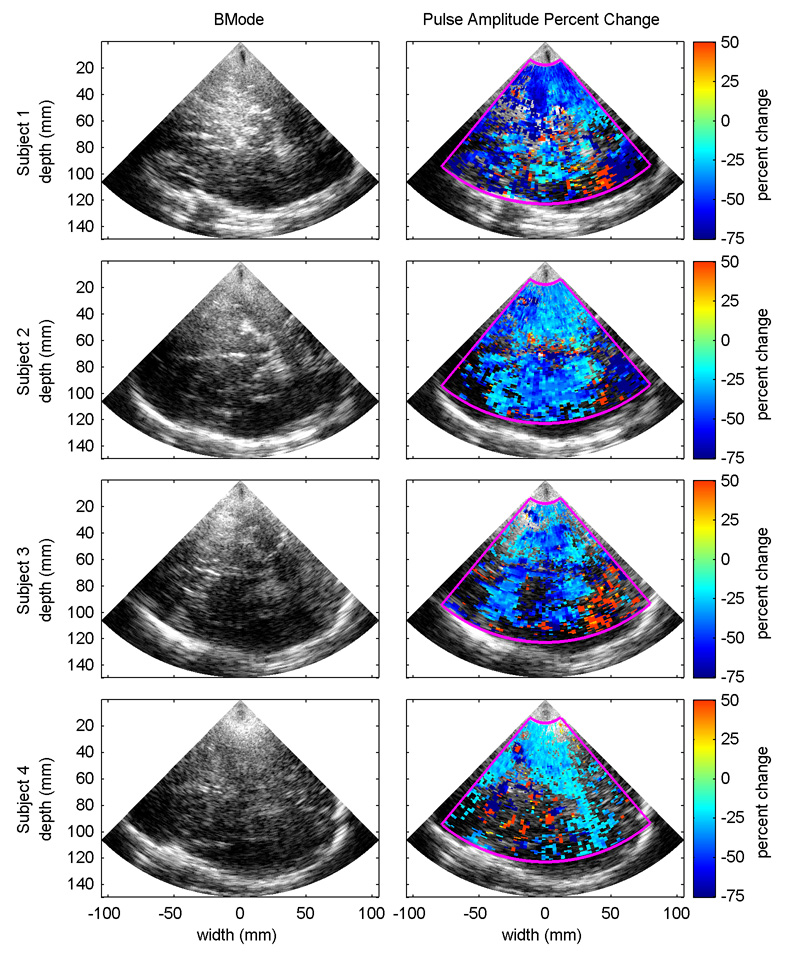
Fig. 6.
BMode image (left column) from the four subjects along with the expected percent change in pulse amplitude for a decrease in end-tidal CO2 from 40 mmHg to 20 mmHg (right column). Pulse amplitude percent change is only shown for sample volumes where the linear regression p-value of pulse amplitude onto end-tidal CO2 was less than 0.01.

