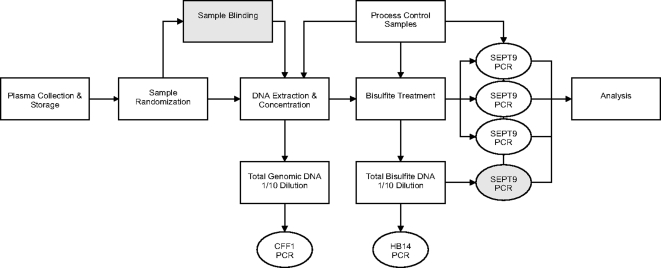
Figure 1. Sample processing workflow.
The diagram depicts the major sample processing and laboratory workflow steps. It shows where process control samples are introduced into the workflow and what assays were used to measure output of each process step. Grey boxes indicate test set specific workflow steps.

