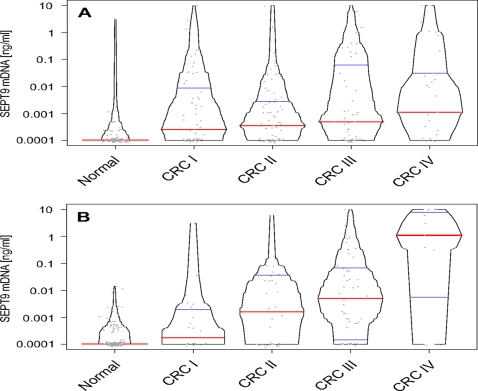
Figure 2. Concentrations of methylated SEPT9 DNA in plasma.
Box-percentile plots of training set methylated SEPT9 DNA concentrations in plasma are shown for colonoscopy-verified normal patients (Normal) and patients with colorectal cancer (CRC). Median DNA concentrations are red horizontal lines; 25th and 75th percentiles are blue horizontal lines. The width of the box-percentile plot at any given height is proportional to the percent of observations that are more extreme in the direction leading away from the median. Individual measurement values are plotted as grey circles. B) Box-percentile plots of testing set methylated SEPT9 DNA concentrations in plasma.

