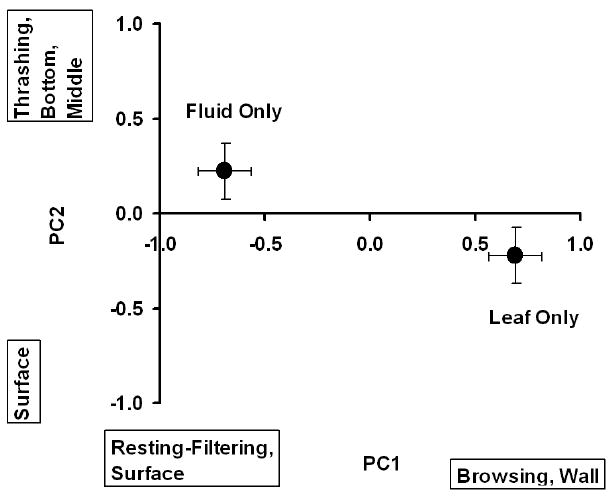
Figure 1.

Means of PC1 and PC2 (± 1 SE) for food environments. PC1 was the primary contributor to the significant multivariate effect of environment. Activities and positions most closely associated with large positive or large negative PC scores are indicated parallel to each axis.
