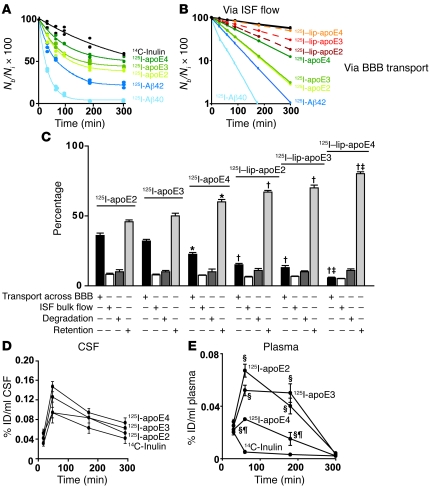
Figure 1. apoE isoform–specific clearance across the mouse BBB in vivo.
(A) Time-disappearance curves of 14C-inulin (reference molecule, black) and 125I-labeled human lipid-poor apoE4 (dark green), apoE3 (light green), apoE2 (yellow green), Aβ42 (dark blue), and Aβ40 (light blue) after microinfusion of tracers mixture into brain ISF in the caudate nucleus. Test tracers were studied at 40 nM. The percentage recovery in brain was calculated using Equation 1 (see Methods). TCA-precipitable 125I-radioactivity was used. Each point represents a single experiment. (B) Time-dependent efflux across the BBB of 125I-labeled Aβ40, Aβ42, lipid-poor apoE2, apoE3, and apoE4 (yellow green, light green, dark green) and lipo-apoE2 (brown), lipo-apoE3 (red), and lipo-apoE4 (orange) was calculated from data in Figure 1A and Equation 4 (see Methods). The ISF bulk flow for studied test tracers was calculated using Equation 2 (see Methods). (C) Relative contributions of transport across the BBB (black bars), ISF flow (white bars), and degradation (dark gray bars) to clearance of apoE isoforms from brain and their retention in the brain (light gray bars) were studied at 40 nM concentrations and calculated from fractional coefficients given in Supplemental Table 1. Mean ± SEM; n = 11–24 mice per group for multiple-time series. *P < 0.05, lipid-poor apoE4 versus lipid-poor apoE3 or apoE2; †P < 0.05, lipo-apoE4, lipo-apoE3, and lipo-apoE2 versus corresponding lipid-poor apoE4, apoE2 and apoE3. ‡P < 0.05, lipo-apoE4 versus lipo-apoE3 or lipo-apoE2. (D and E) Time-appearance curves of 14C-inulin and 125I-labeled lipid-poor apoE4, apoE3, and apoE2 (TCA-precipitable 125I-radioactivity) in the CSF (D) and plasma (E) from experiments as in A. ID, injected dose. §P < 0.05, apoE2, apoE3, and apoE4 versus inulin; ¶P < 0.05, apoE4 versus apoE2 or apoE3. Mean ± SEM; n = 3–5 mice per group.

