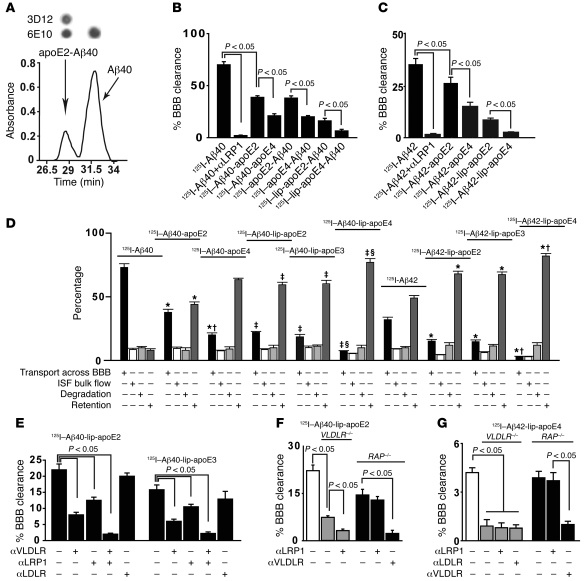
Figure 3. apoE isoforms disrupt Aβ clearance across the mouse BBB in vivo (apoE4>apoE3 or apoE2) by redirecting differentially redirecting transport of Aβ-apoE complexes from LRP1 to VLDLR.
125I-labeled apoE-Aβ complexes (40 nM) and 14C-inulin were microinfused into brain ISF and clearance determined at 90 minutes. 125I-label was either on Aβ40 and Aβ42 or on apoE2 and apoE4. (A) FPLC purification of apoE2-Aβ40. Upper panel shows dot blots of Aβ40-apoE2 and free Aβ peaks with Aβ-specific (6E10) and apoE-specific (3D12) antibodies. (B and C) BBB clearance of Aβ40 (B) and Aβ42 (C) with and without an LRP1-specific blocking antibody and of their complexes with lipid-poor and lipo-apoE2 and lipid-poor and lipo-apoE4, as indicated. (D) Clearance of Aβ40 and Aβ42 by transport across the BBB (black bars), ISF flow (white bars) and degradation (light gray bars) and retention in the brain (dark gray bars) studied from different 125I-Aβ40-apoE and Aβ42-apoE complexes at 40 nM and compared with free Aβ40 or Aβ42. 125I-label was on Aβ. Clearance and retention were calculated from fractional coefficients using Equations 2, 5, and 6 (see Methods). Mean ± SEM, n = 5–6 mice per group in a single time-point series. *P < 0.05, Aβ40-apoE2 and Aβ40-apoE4 versus Aβ40 and Aβ42–lipo-apoE2, Aβ42–lipo-apoE3, and Aβ42–lipo-apoE4 versus Aβ42; †P < 0.05, Aβ40-apoE4 versus Aβ40-apoE2 and Aβ42–lipo-apoE4 versus Aβ42–lipo-apoE3 or Aβ42–lipo-apoE2; ‡P < 0.05, Aβ40–lipo-apoE2 and Aβ40–lipo-apoE4 versus Aβ40-apoE2 and Aβ40-apoE4; §P < 0.05, Aβ40–lipo-apoE4 versus Aβ40–lipo-apoE3 or Aβ40–lipo-apoE2. (E) BBB clearance of 125I-Aβ40–lipo-apoE2 and 125I-Aβ40–lipo-apoE3 in control mice with and without blocking antibodies to VLDLR, LRP1, and LDLR. (F and G) BBB clearance of 125I-Aβ40–lipo-apoE2 (F) and 125I-Aβ42–lipo-apoE4 complexes (G) in control (white bars), VLDLR–/– (gray bars), and RAP–/– (black bars) mice with and without blocking antibodies to LRP1, VLDLR, and/or LDLR. Mean ± SEM; n = 4–6 mice per group.

