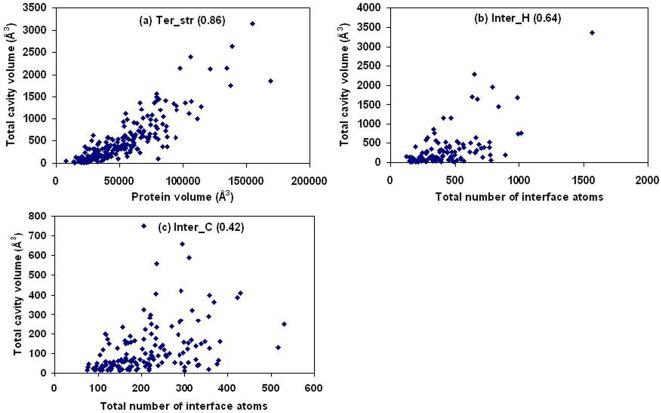
Figure 2. Dependence of the total volume of cavities on the volume (or the total number of atoms) of the protein (or the interface).
Plot of total volume of cavities against (A) the volume of the protein tertiary structure, and (B,C) the total number of atoms in interfaces. The correlation coefficient, r, is given in parentheses. In (A) the equation for the least-squares line is y = 0.016x–311 (R 2 = 0.74); if approximated by a power law the corresponding equation is (A) y = 0.000002x 1.779 (R 2 = 0.70). If one uses the total number of atoms in the tertiary structure (in place of the volume) the distribution looks very similar to (A) and the two equations are y = 0.371x–279 (R 2 = 0.75) and y = 0.0009x 1.687 (R 2 = 0.71).

