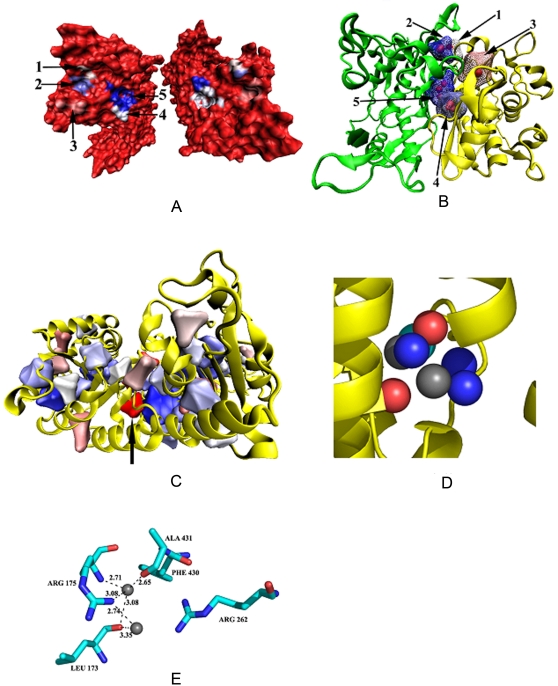
Figure 4. Visualization of different features in some cavities.
(A) Surface representation of the structure with the PDB code, 1bkp, with five interface cavities. The two subunits are rotated about a vertical axis and taken apart to show how cavities are formed between them. (B) The cartoon representation of the secondary structures for the same protein as in (A), along with the maze representation of the cavities (with the enclosed water molecules in red). The individual cavities are labeled and their volume (Å3), number of water molecules and Rvs are as follows. 1: 12.3, 1, 0.99; 2: 13.3, 1, 0.99; 3: 31.7, 1, 0.75; 4: 110.5, 3, 0.84; and 5: 111.6, 3, 0.83. (C) Ter_str cavities within one subunit of the dimeric molecule, 1dpg. One of the cavities (pointed by an arrow, volume: 20.7 Å3 and Rvs: 0.92) with two water molecules is shown in (D) along with the CL atoms, and all the hydrogen bonds are given in (E). Diagrams (C–E) do not have the molecules in the same orientation. In (D) and (E) the water molecules are in grey.

