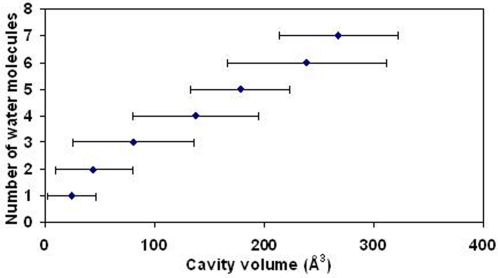
Figure 8. Plot of the number of water molecules present in a cavity against its volume (Å3).
For a given value along the y axis the average of all the values along the x axis is shown (the horizontal bars representing the standard deviations). The numbers of points used for averaging are 948, 321, 83, 26, 10, 5 and 3 (six cavities have >7 water molecules). The equation for the least-squares line is y = 0.023x+0.70 (R 2 = 0.99).

