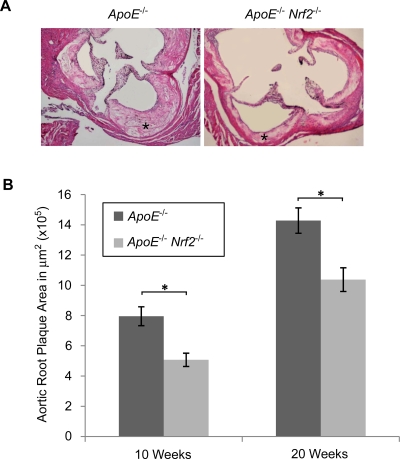
Figure 2. Cross-sectional plaque area at the aortic root.
(A) Representative images of aortic cross-sections of ApoE −/− and ApoE −/− Nrf2 −/− male mice after 20 weeks on a high fat diet, showing plaques in the arterial walls (asterisks). (B) Quanitfication of plaque area ±SEM after 10 and 20 weeks on a high fat diet. *p<0.05 by a two-tailed Student's t-test. N = 4–6 per group.

